LLM Wiki and Mind Maps
In April 2026, Andrej Karpathy shared a concept on X: LLM Wiki. His idea was to use an LLM as a knowledge curator — you feed it articles, papers, meeting notes, and other materials, and the LLM automatically organises them into Markdown wiki pages with summaries and cross-references, gradually building up a personal knowledge base.
The post got a lot of buzz. My first reaction was: is this not what I started building a month ago? We went about it differently (Karpathy has Claude Code write encyclopedia-style articles; I have Claude Code draw mind maps), but the core idea is the same — let AI study for you and structure the knowledge.
In September 2025, Jesse Vincent published a blog post called Using GraphViz for CLAUDE.md. He discovered that writing Claude Code’s operational rules as flowcharts in the Graphviz DOT language made the instructions far more precise than Markdown.
After reading that post, I thought: if DOT can help AI understand rules, could it also help AI digest knowledge? So I started having Claude Code convert documents into mind maps in DOT format.
The early results were disappointing. I fed a document to Claude Code and asked it to organise the knowledge into a DOT graph. Claude essentially copied the document’s section structure straight into DOT. Three chapters became three clusters. The cluster titles were just the section headings, verbatim. The edges between nodes had only vague labels like “supports” or “related.” Claude thought it was learning, but it was really just rearranging the original paragraphs.
This made me realise: changing the format alone does not help. I needed a framework to guide how the AI organises what it reads.
Before working with Claude Code, I had taken Justin Sung’s ICanStudy (ICS) course. The course centers on using mind maps for learning, but it emphasises that you cannot just draw them however you like — every map must be checked against the GRINDE checklist:
- G — Grouped: Related concepts should be clustered, with maximum four branches per node. Group titles must be conceptual questions, not just terminology.
- R — Reflective: The structure must reflect the underlying argument, not mirror the original document’s chapter order. If your cluster titles match the table of contents, you have not actually thought about the material.
- I — Interconnected: Edges between groups must express causal relationships. Each edge should answer: “Knowing A, how does that change my understanding of B?”
- N — Non-verbal: Use visual elements intentionally — different shapes for different types of concepts (diamonds for questions, rectangles for facts, double circles for core answers).
- D — Directional: The graph should have a clear reading direction, with a “central answer” node that runs through the entire map and bold edges marking the main argument chain.
- E — Emphasised: Use bold edges, dashed lines, and different shapes to establish visual hierarchy.
I translated each GRINDE rule into a skill — a structured prompt — that Claude Code could follow. The workflow became: Claude first drafts a DOT graph freely, then checks it against the GRINDE checklist item by item, revises it, and repeats until everything passes. Finally, a separate AI agent acts as a reviewer, specifically looking for flaws in the draft and reporting either “pass” or “needs revision.” A failing grade means it goes back for rework — just like a paper getting rejected by a journal.
After applying GRINDE, the DOT graphs improved dramatically in structure. But when I read through them, something still felt off: the causal relationships were not clear enough.
The culprit was the edge labels. Claude tends to use single verbs for labels — things like “determines,” “triggers,” “constrains.” These words tell you two concepts are related, but they do not tell you why.
My requirement was specific: every edge label must be a complete sentence showing the full causal chain — action → consequence → outcome.
Here is an everyday example. Suppose you are drawing a knowledge graph about environmental issues:
- Bad label:
causes(tells you there is a relationship, but not how) - Good label:
heavy fertiliser use → nitrogen and phosphorus runoff into rivers → algal blooms → dissolved oxygen depletion → fish die-offs
It sounds like a minor formatting rule, but it transformed the usefulness of the graphs. When every edge carries a complete chain of reasoning, you can fully understand the entire argument just by reading the DOT graph, without ever going back to the source document.
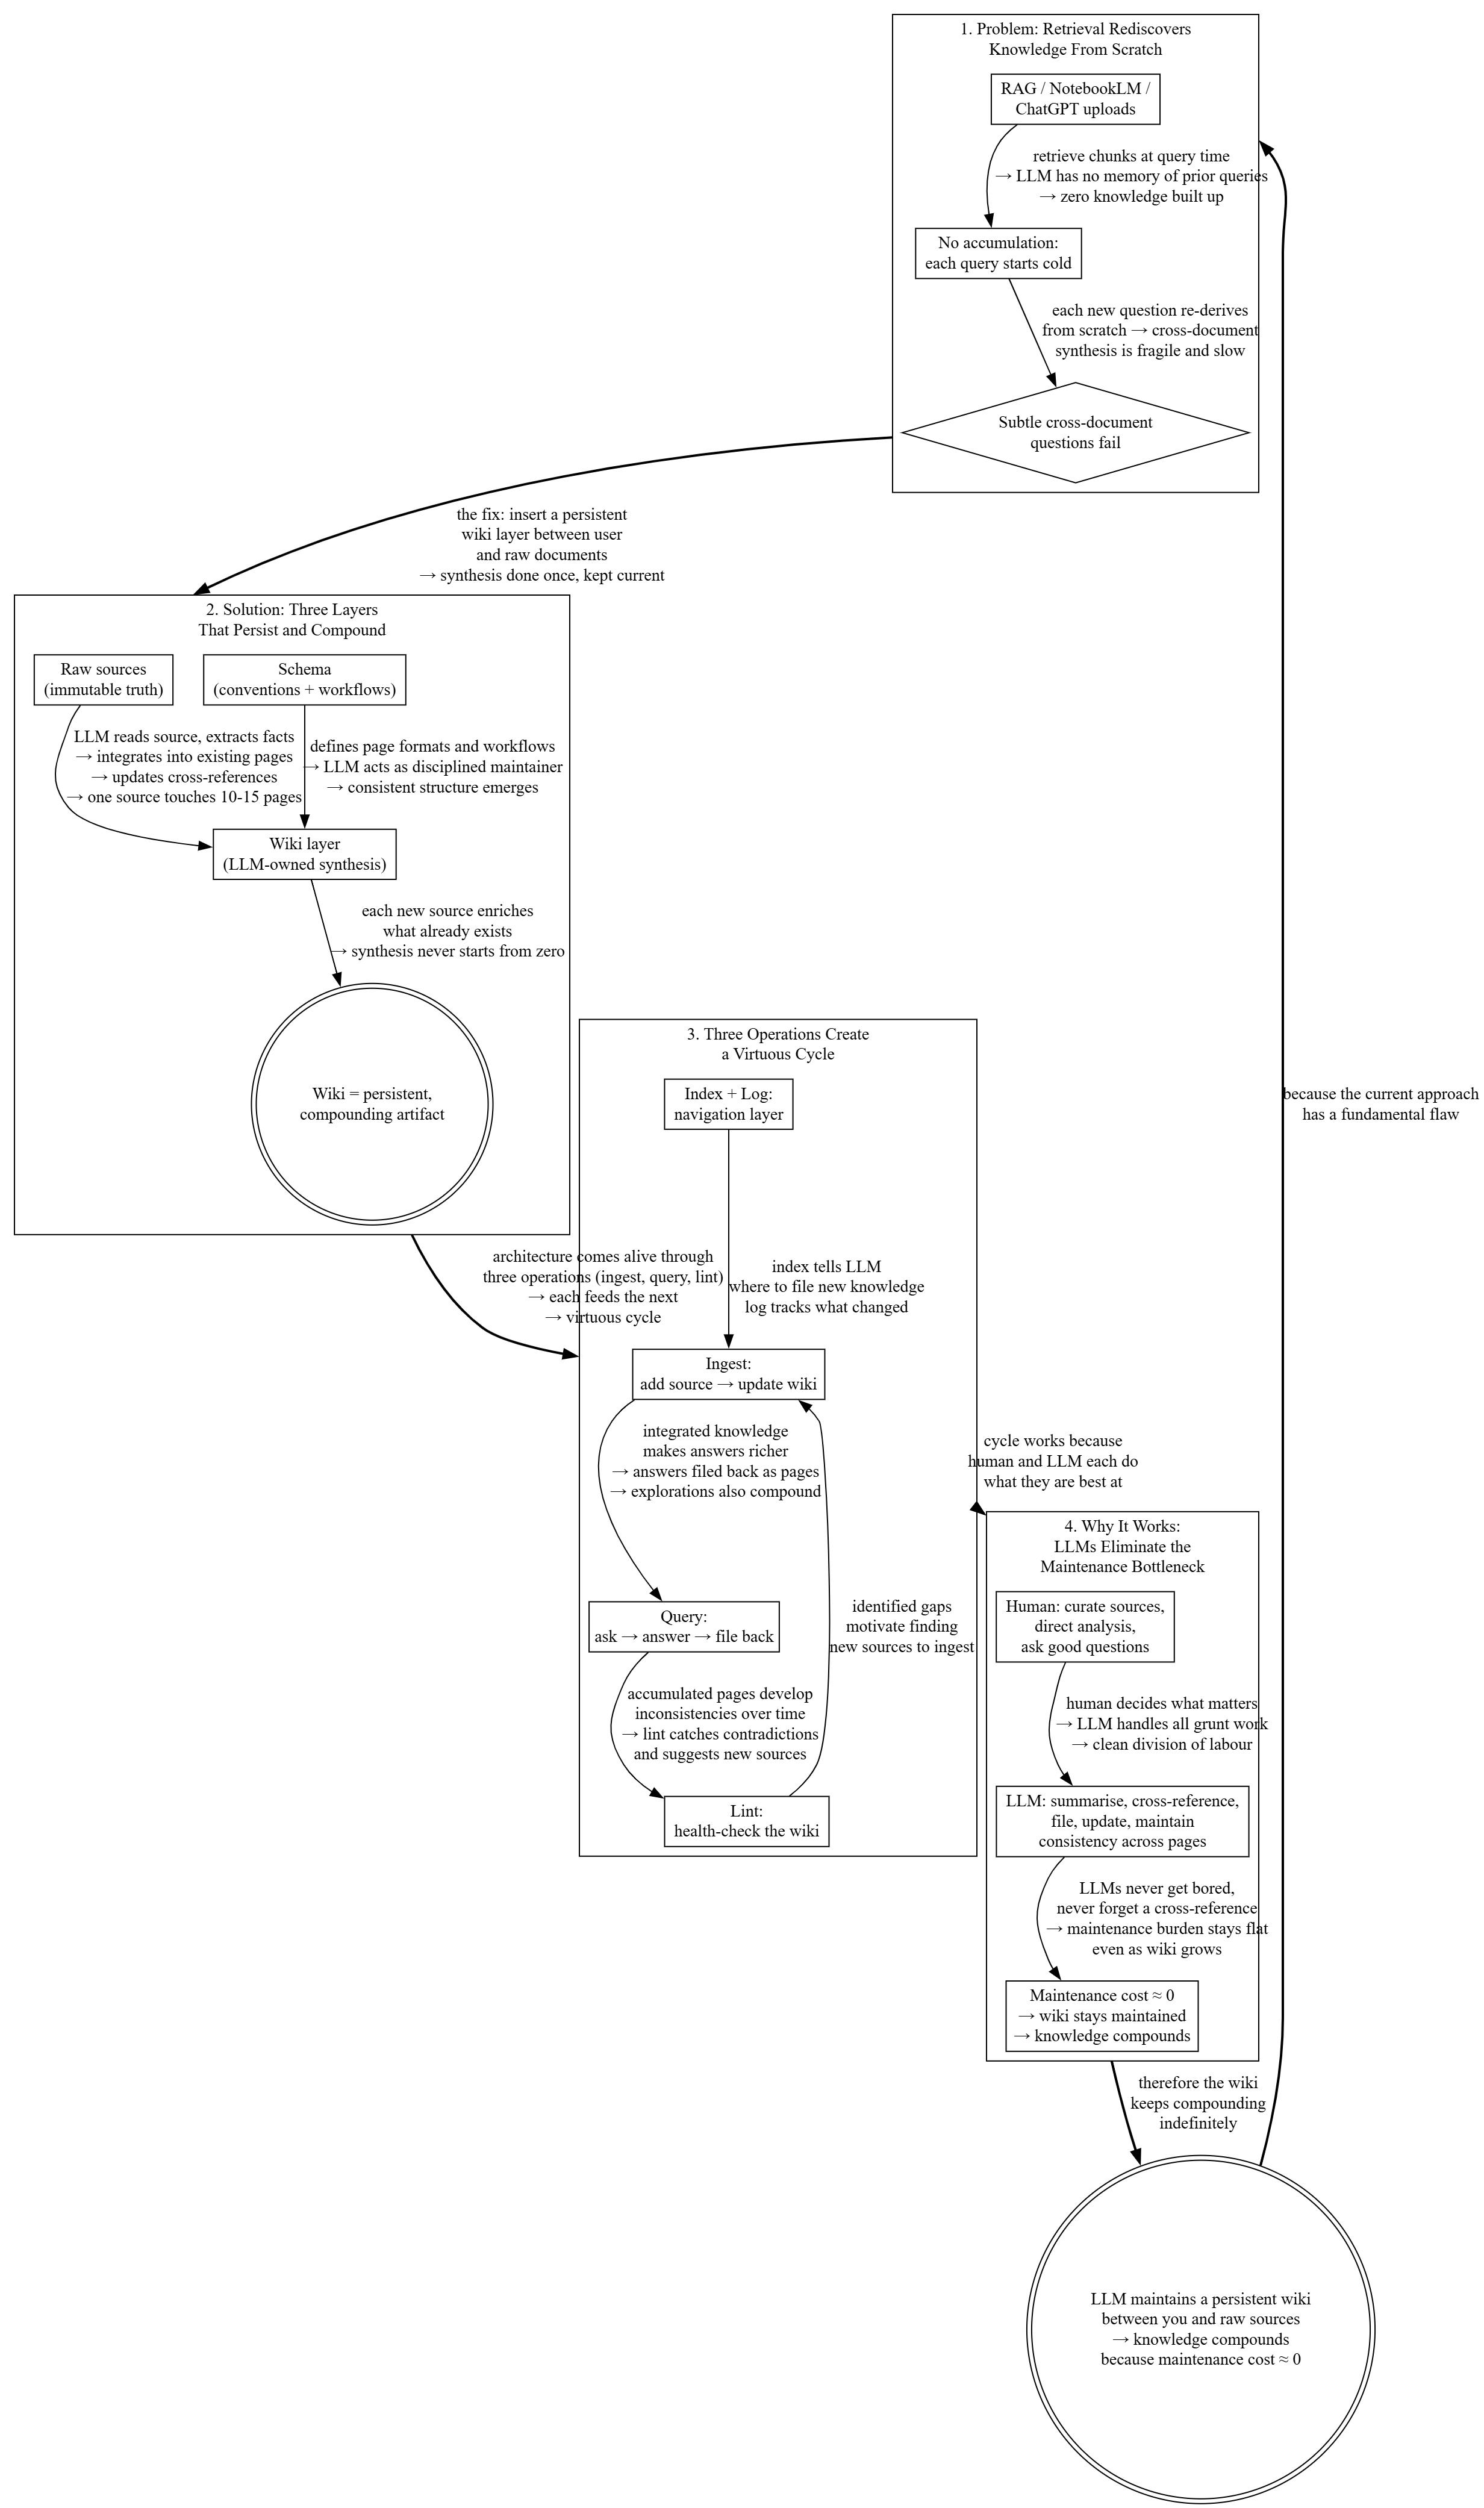
Here is what the output actually looks like. I ran Karpathy’s own LLM Wiki article through my system and produced this DOT mind map:
Comparing the Two Systems
In Karpathy’s wiki, the smallest unit of knowledge is a paragraph — prose describing a concept or entity. It is readable, but a paragraph has no inherent “directionality” — it does not point anywhere.
In my system, the smallest unit of knowledge is a labeled edge — a causal claim. For example: “increasing the learning rate → gradient overshoots the minimum → loss oscillates → training diverges.” This edge is itself a hypothesis that can be verified or refuted, and it is tagged with a source reference. Knowledge is not just stored — it becomes an auditable argument structure.
My system has a full quality framework. After each batch of DOT graphs is completed, a team of agents reviews them against the GRINDE checklist item by item. They ask: Do the cluster titles just copy the document’s section headings? Do the edge labels include causal chains? Do the node shapes convey semantic meaning? Is the main argument chain marked with bold edges? If any item fails, the verdict is “needs revision,” and Claude must fix it and resubmit.
In Karpathy’s system, the user’s main role is “knowledge procurement” — finding good material, feeding it in, and occasionally asking questions. The LLM does all the organizing. The user is essentially a librarian deciding what goes on the shelves.
In my system, the user is more like a coach. I correct Claude’s edge labels (“this causal relationship is backwards”), ask for re-grouping (“these two concepts belong in the same cluster”), and even teach it new rules (“from now on, all edge labels must include causal chains”). The system records my corrections in a knowledge rules file so it will not make the same mistakes again.
Results in Practice
When I use this system to answer technical questions, Claude Code’s responses are convincing and logical. Not because the AI became smarter, but because the knowledge was already organised into rigorous arguments — with core questions, causal chains, source references, and review checks. The AI just has to assemble pre-structured arguments instead of hunting through prose paragraphs for answers each time.
If you are thinking about building your own LLM knowledge base, my advice is: do not just think about “how to store information” — also think about “how to make sure the AI truly understands causal relationships.” Karpathy’s LLM Wiki is a great starting point. But if your domain demands deep understanding rather than just broad coverage, I would suggest also looking into learning science frameworks and review mechanisms — the difference in depth will be significant.
The skill is available here: https://gist.github.com/mhwang-1/d0f45f2ec26d89b643a54c18f4e2d53b